Statistics Class 9 Notes

Chapter 14 Statistics
Detailed notes to NCERT Class 9 Math Chapter 14 - Statistics are presented in this article. Students across India who are using NCERT textbooks to prepare for their Grade 9 Mathematics exam can refer to the notes provided here. NCERT notes for 9th Grade Math Chapter 14 enable students to better understand concepts and complete assignments and homework on time. It also helps you review chapters quickly. Students can also download the NCERT notes for Grade 9 Math Chapter 14 directly from the link provided in this article for offline study.
MATHEMATICS NOTES CLASS 9th CH-14
Points to Remember
Given below are some of the important points to note for NCERT notes for Class 9 Chapter 14, Statistics:
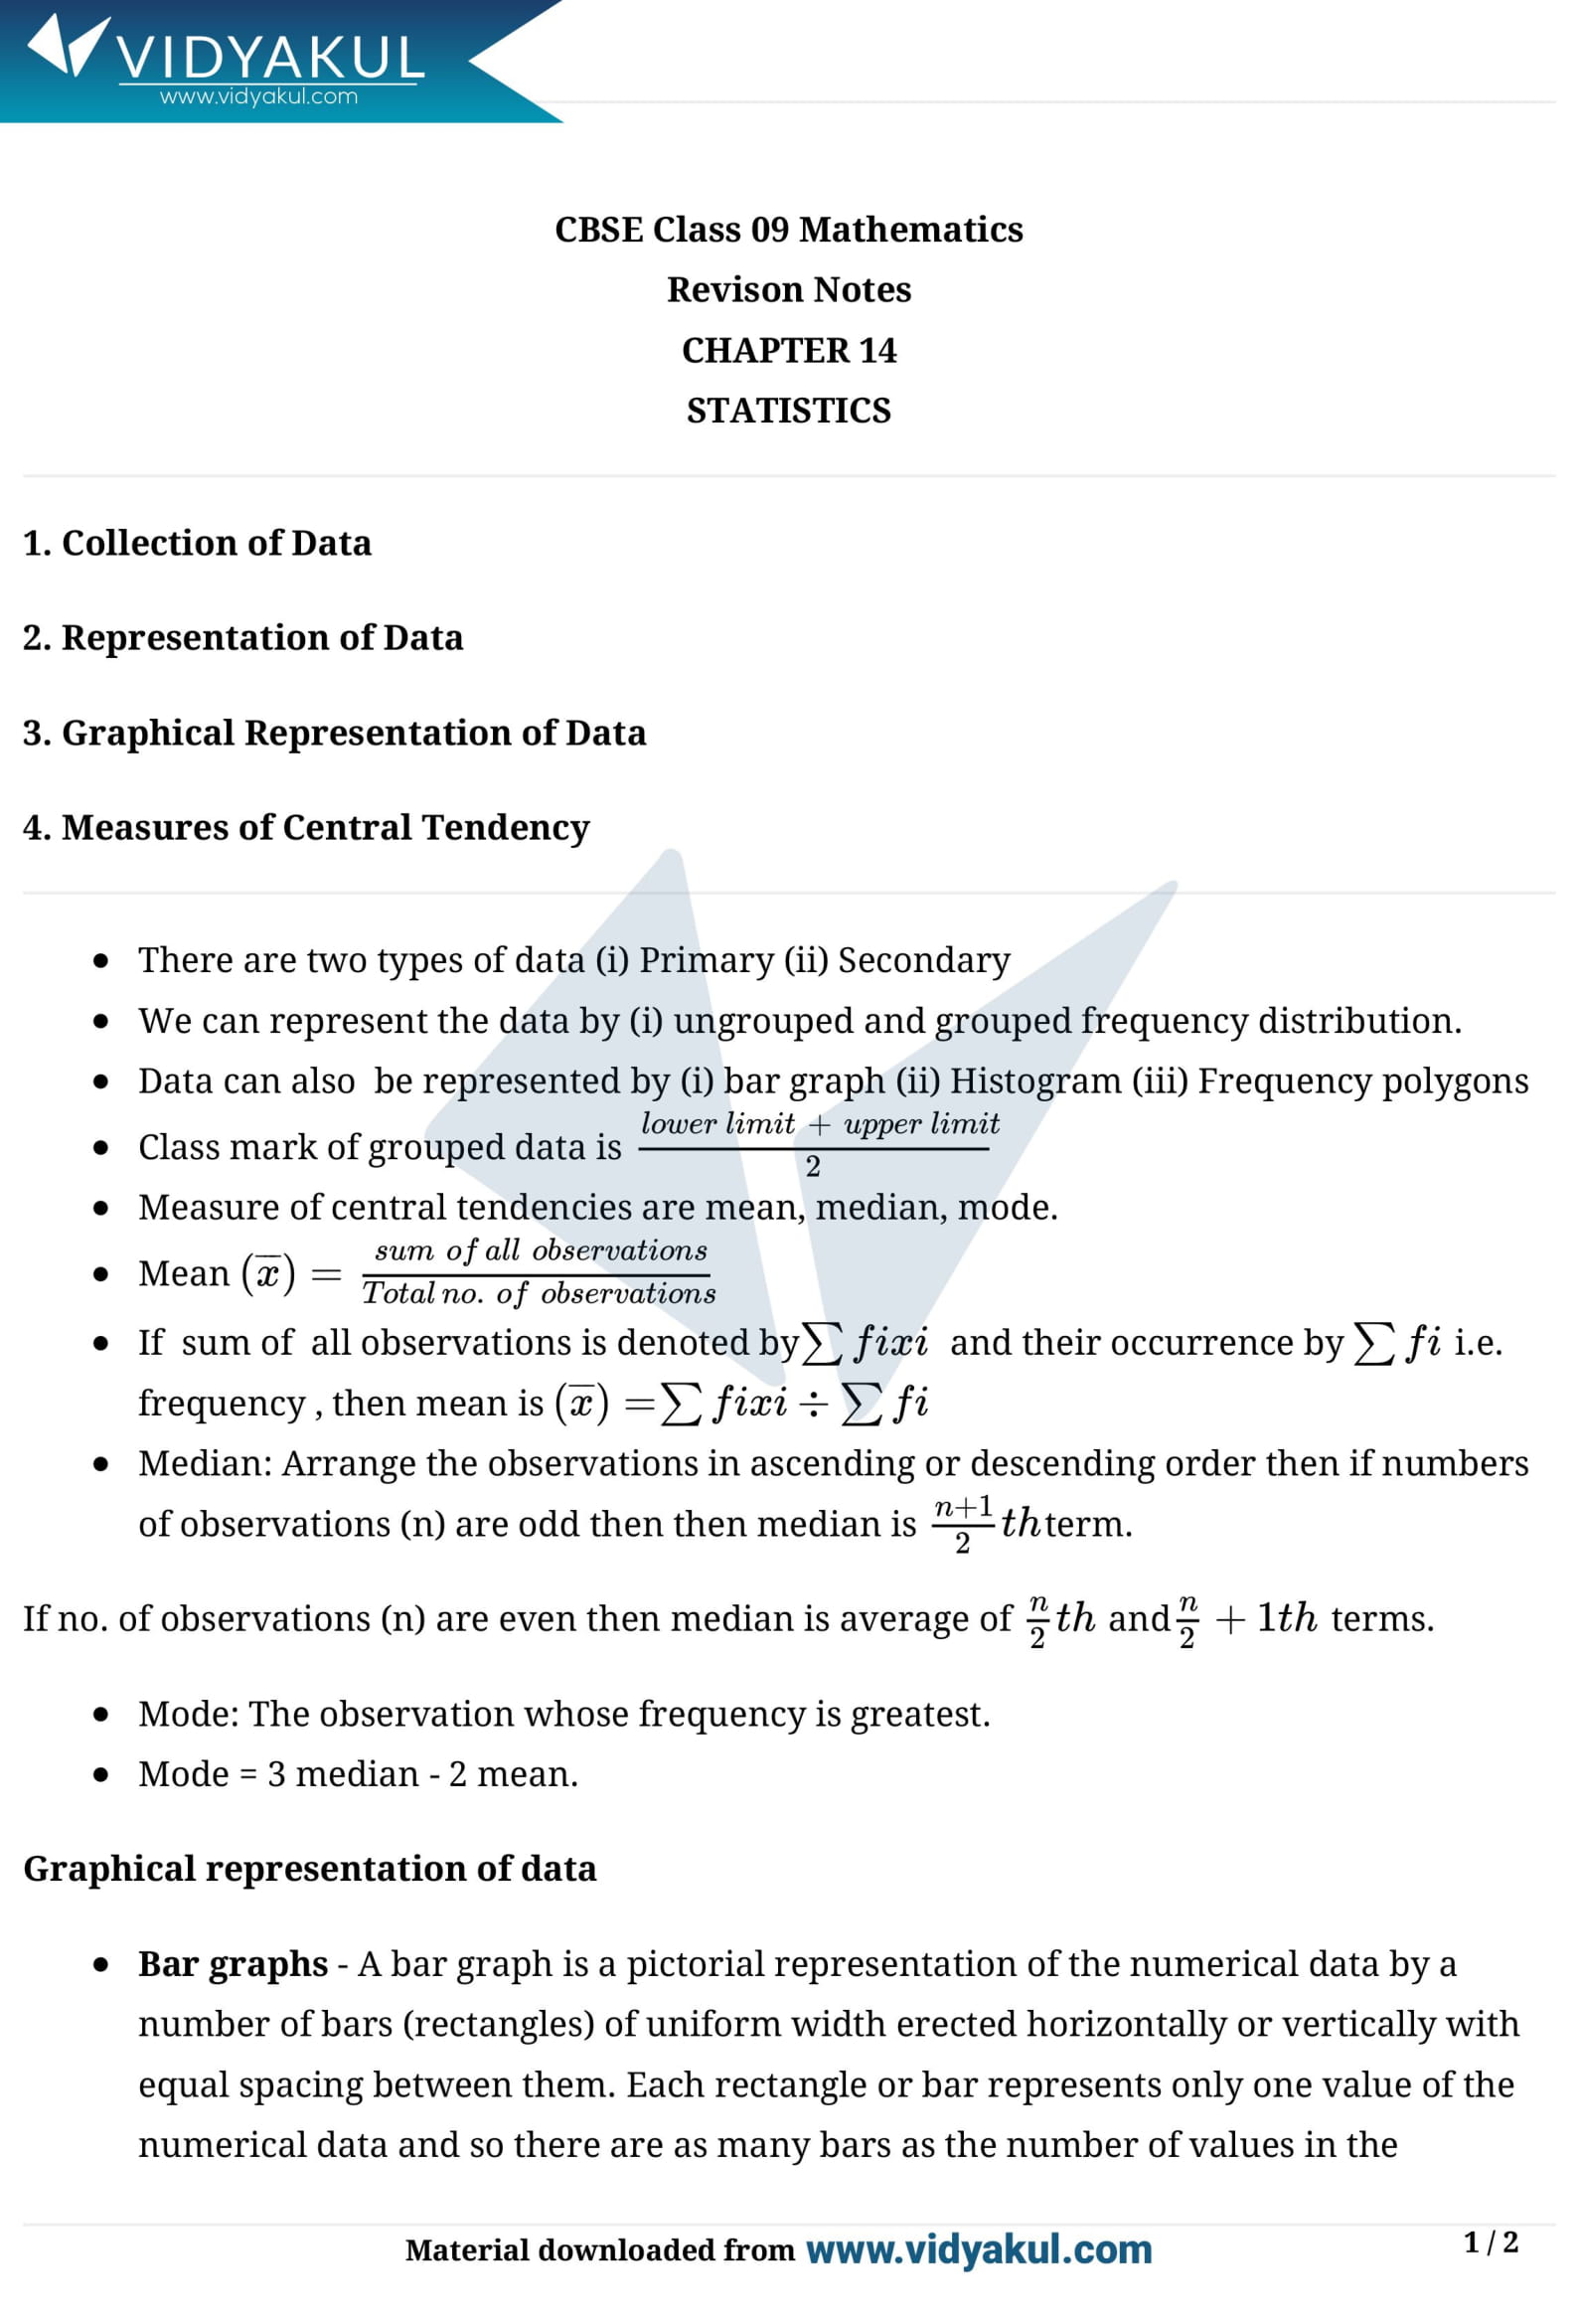
The word ‘data’ means information. Its exact dictionary meaning is “given facts”.
The number of times an observation occurs in the given data is called the frequency of the observation.
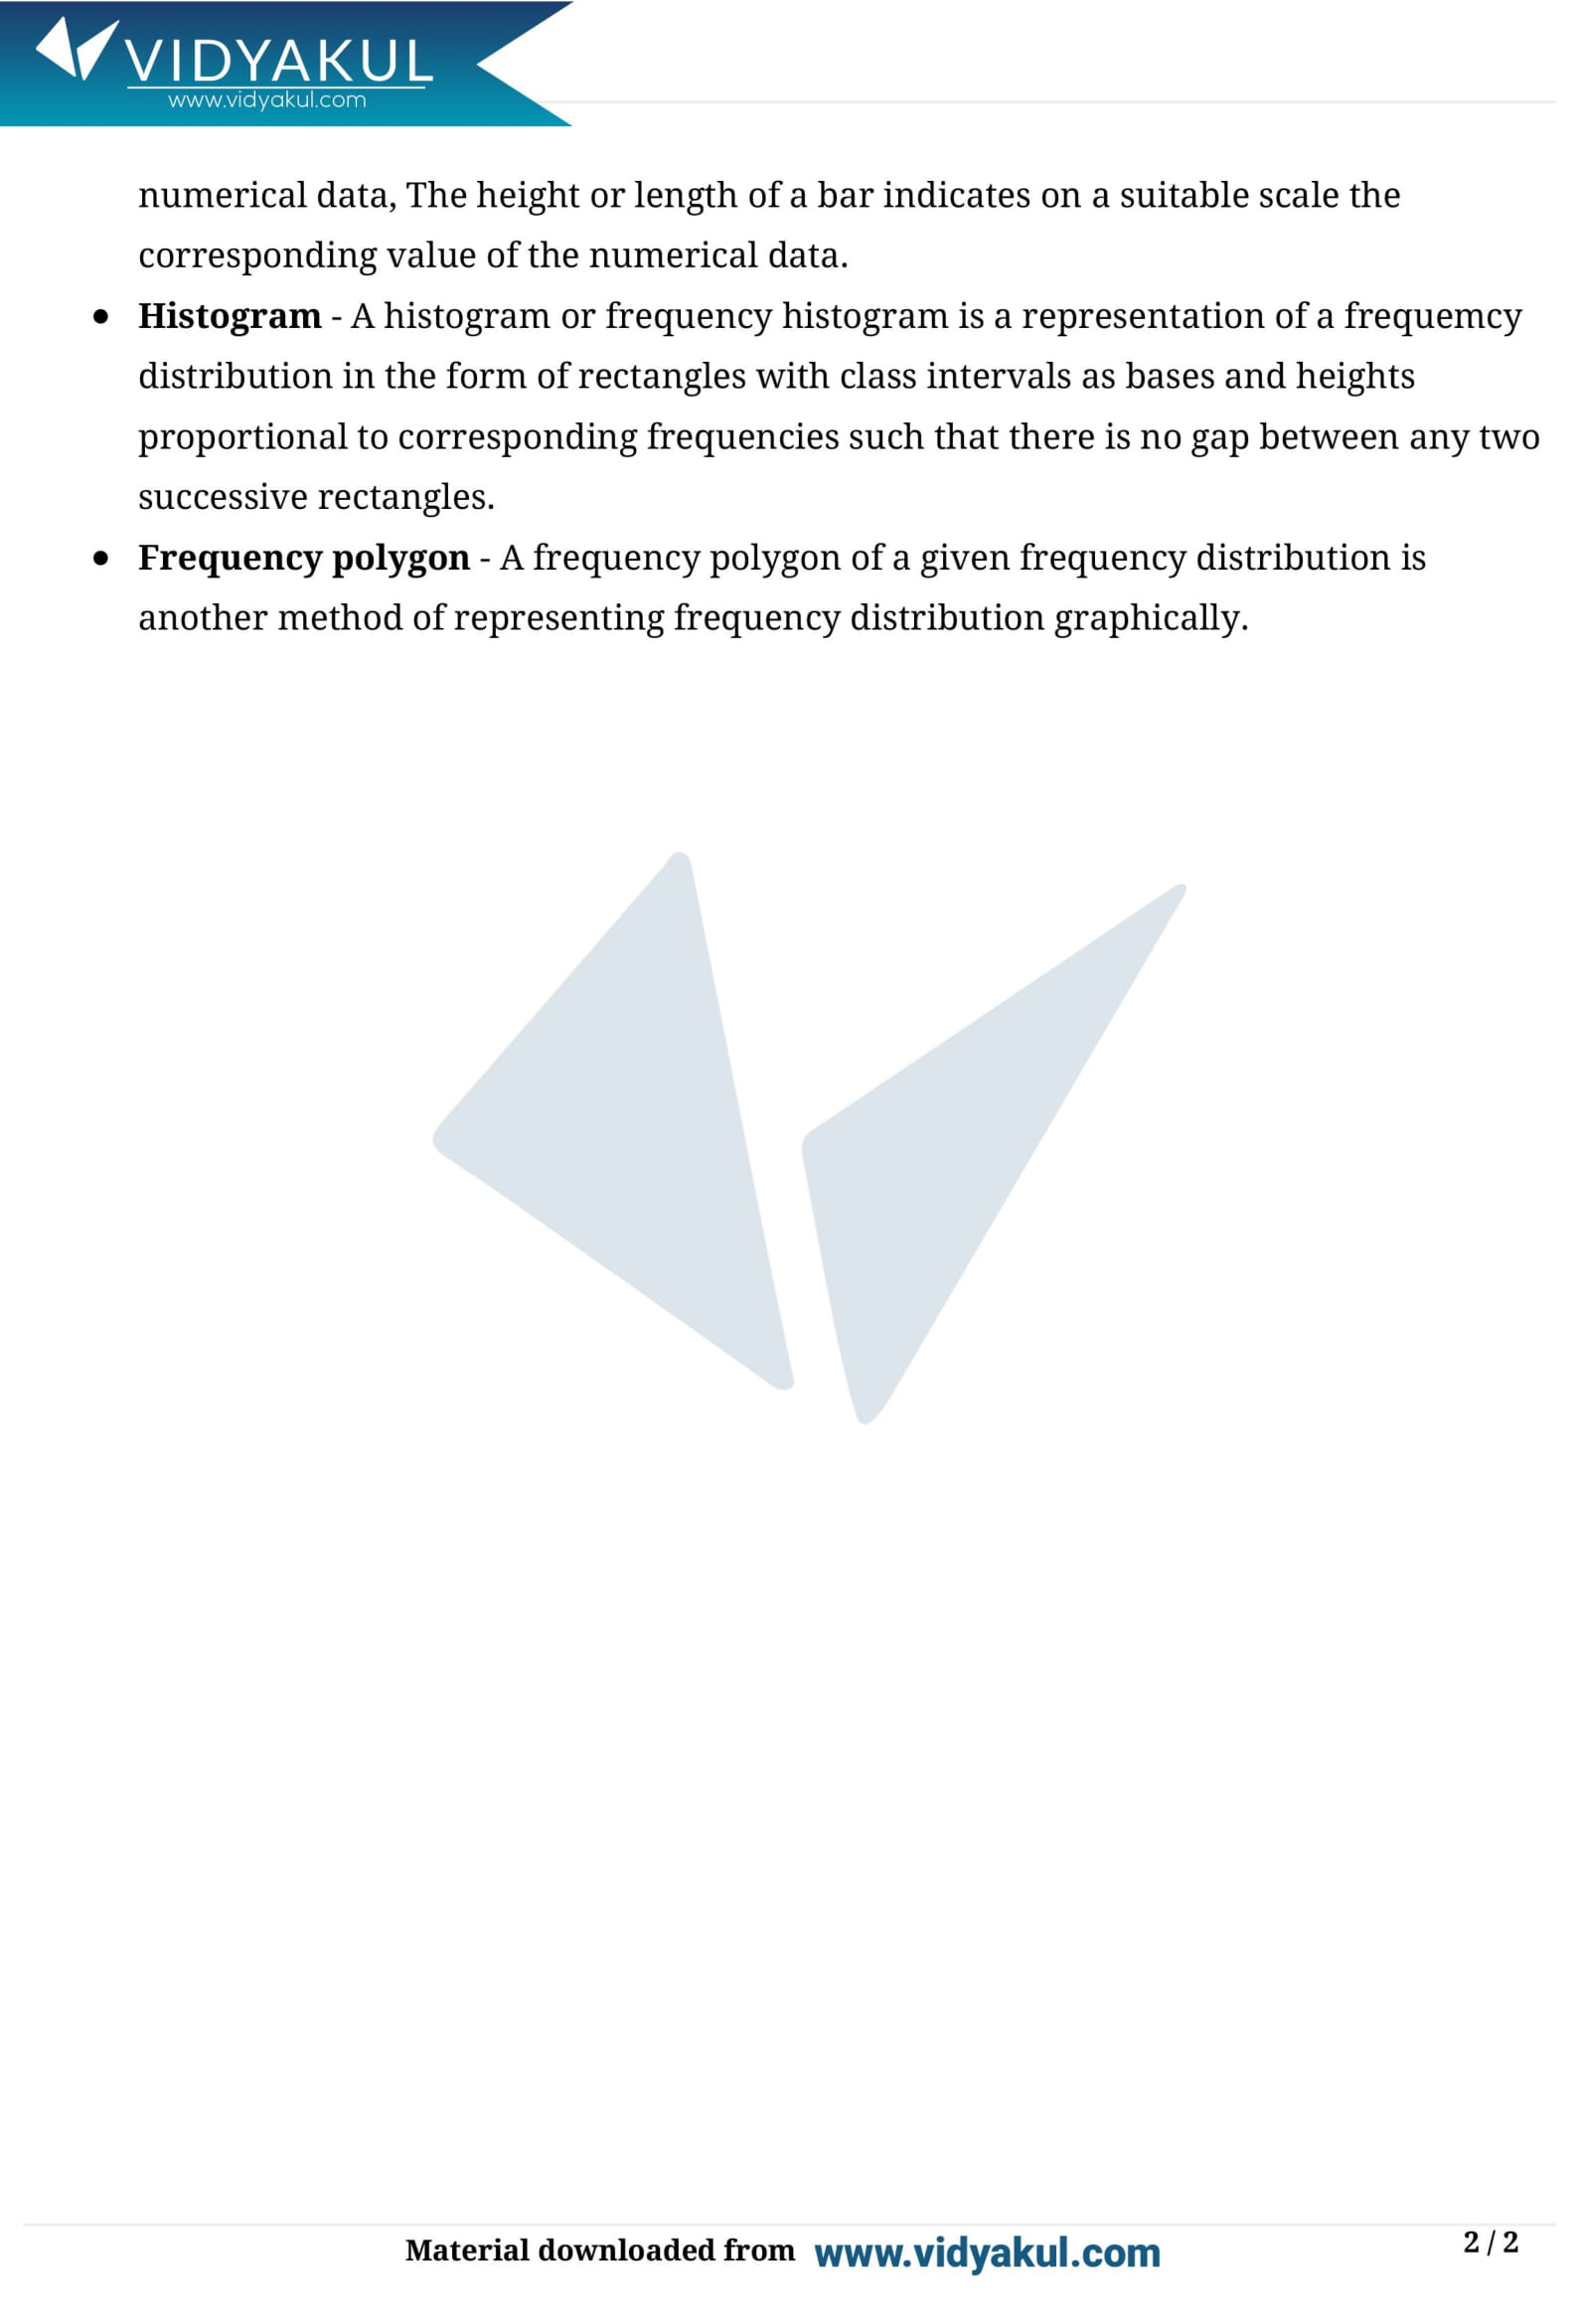
A bar graph is a pictorial representation of the numerical data by a number of bars (rectangles) of uniform width erected horizontally or vertically with equal spacing between them.
A frequency polygon of a given frequency distribution is another method of representing frequency distribution graphically.
The mode is the most frequently occurring observation.
Students can get additional information about Chapter 14 Class 9 on Vidyakul.
Topics and Sub-topics
Ninth graders need to make sure their concepts are clear. So, referencing NCERT notes for class 9, chapter 14 can be very helpful. It will be easier for students to prepare for the exam.
Vidyakul provides all NCERT notes for free. Everything students need to prepare for NCERT Grade 9 Mathematics is available on Vidyakul. We advise all our students to solve all their questions with the help of notes. Before going into the details of the NCERT Grade 9 Math notes for Statistics chapter, let's first review the topics and subtopics covered in this chapter.
.
The word ‘data’ means information. Its exact dictionary meaning is “given facts”.
The number of times an observation occurs in the given data is called the frequency of the observation.
A bar graph is a pictorial representation of the numerical data by a number of bars (rectangles) of uniform width erected horizontally or vertically with equal spacing between them.
A frequency polygon of a given frequency distribution is another method of representing frequency distribution graphically.
The mode is the most frequently occurring observation.
Learn more about the mean, median and mode in Statistics Class 9 Notes pdf.
Download this solution for FREE Download this PDF


